
USMNT
Grouped or Glory: Intro
USMNT
Way-too-early USMNT 2030 FIFA World Cup roster projection
World Cup roster projections are a futile business.
That’s particularly true when you do it a whole four years out.
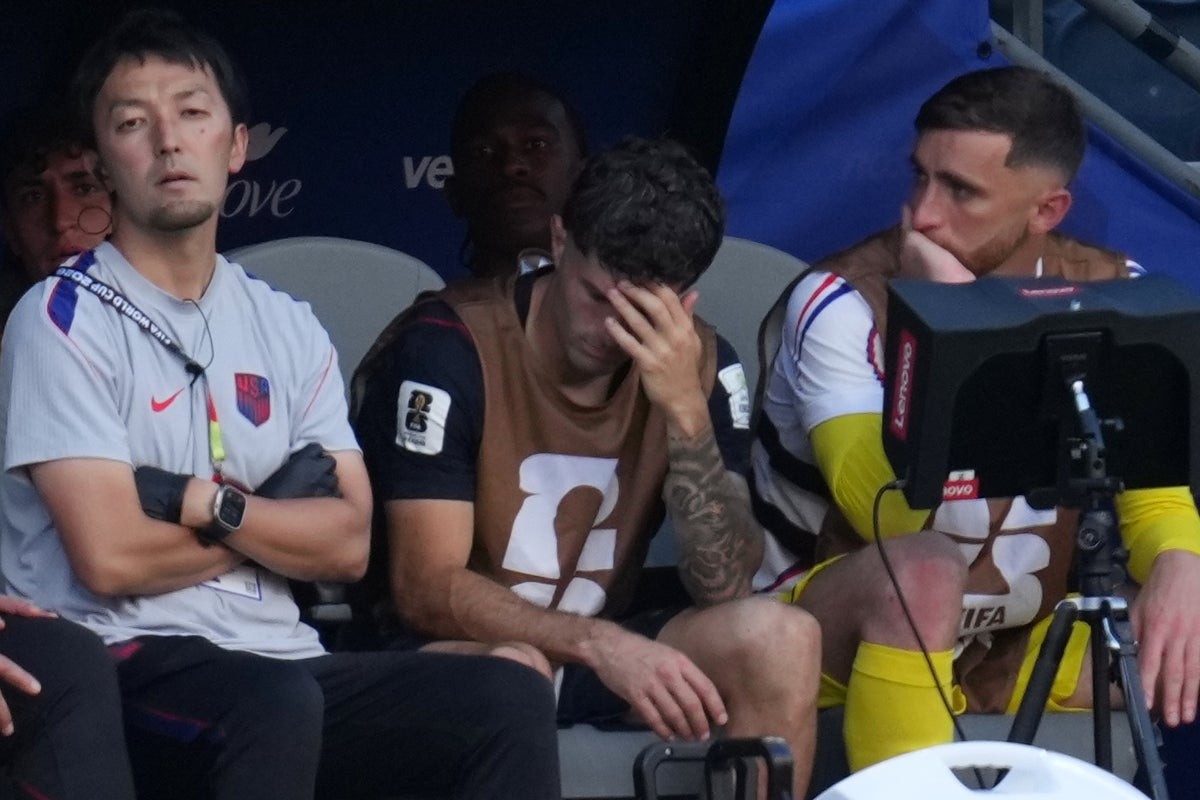
Yet, every four years, we do it anyway. The United States crashed out of their one-in-a-generation home World Cup this week after a 4-1 demolition by Belgium in Seattle, deferring their dreams of a first star for at least another cycle. Now it’s time to take a first-ever stab at who the players on that 2030 team will be.
Of course, this is more of an educated guess than a clear-cut prediction. A lot can happen in four years (see: Alex Freeman and Sebastian Berhalter or Yunus Musah and Josh Sargent). With that being said, here’s my current projected 26-man squad for the next World Cup, which will be held in Spain, Portugal, and Morocco.
Goalkeepers
1. Chris Brady (Current Club: Chicago Fire; Age in 2030: 26)
The crop of goalkeepers that the U.S. brought to the 2022 and 2026 World Cups is the weakest pool in decades. Fortunately, there are a few high-end prospects who will be old enough by 2030 to hopefully make progress on that front. One of those prospects – Chris Brady – was the third-string at this past World Cup (the youngest goalie the U.S. has brought to a World Cup since Tony Meola and Kasey Keller in 1990) and will be just beginning to enter his prime for the next one.
In terms of skill set, Brady has all the tools to be a world-class #1. His shot-stopping and reaction time are excellent; he possesses great size and reach, and has made progress on his ball-playing ability over the last three seasons in MLS. While his decision-making does leave something to be desired – meaning he isn’t quite ready yet to play regularly at the international level – it is an asset that will hopefully improve with time and experience and is completely normal for such a young goalkeeper. A move to a major European league should happen in the next few years, and he’s probably the current favorite to be the starter in 2030.
2. Diego Kochen (Lyngby Boldklub, on loan from FC Barcelona; 24)
In terms of talent, the other potential huge star is Barcelona’s Diego Kochen, who just joined Danish club Lyngby on loan in search of more minutes. Kochen was originally set to join the 2026 squad as a training player, but the need for a minor surgery meant he only stuck around for the pre-tournament friendlies. That’s been the story of his career so far: high hopes, but often paused by injuries or other setbacks. If that can be resolved, Kochen absolutely has a shot of competing with Brady, and those two seem like the best options to be the future of the U.S. goalkeeping position. If not, other talents like Julian Eyestone, Andrew Rick, or even still-quite-young Gaga Slonina could emerge to break into that picture.
3. Matt Turner (New England Revolution; 36)
With the hope being that two young goalkeepers will take over the position, it would be fair to guess that the third-string in four years will be a veteran. Matt Freese was the starter in 2026, but was clearly a weak link, and has had numerous blunders for the USMNT since his debut 13 months ago; he’ll absolutely stick around in the national team picture for at least a few more years, and still be 31 in 2030, but at this point I don’t know that he increases either the floor or the ceiling. For that reason, Matt Turner is my veteran pick for 2030, assuming he maintains his level in MLS with the Revolution; he will be 36, but would be a calm presence in the locker room with two prior World Cups under his belt, and fits the mold of a #3 keeper at that age.
Potential pool players: Matt Freese, Julian Eyestone, Andrew Rick, Gaga Slonina, Leonard Prescott
Center backs
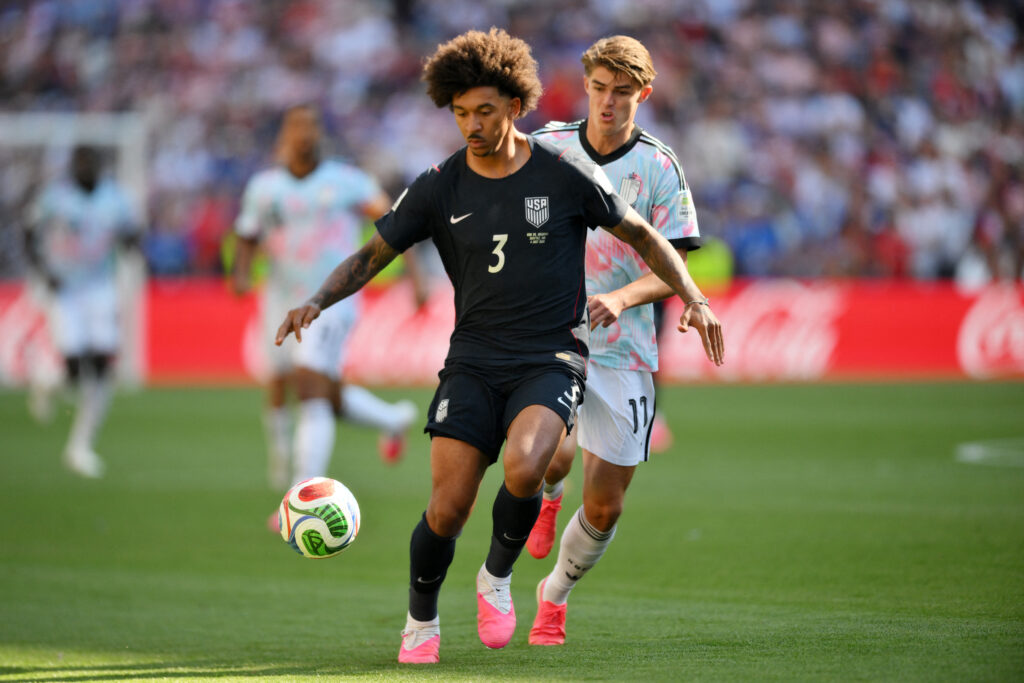
1. Chris Richards (Crystal Palace; 30)
After playing every minute in four of the Americans’ five games in 2026, Richards is the bright spot in what has otherwise been a pretty poor generation of U.S. central defenders. Seeing as defenders typically peak between the ages of 28 and 31, the next World Cup could be his to be a true team leader in. In fact, as long as he stays healthy and continues to progress and mature in the Premier League, Richards currently seems like the safest bet for U.S. captain in 2030.
2. Noahkai Banks (FC Augsburg; 23)
This is where things get interesting. Tim Ream (who will be 42 at the next World Cup) defied all the odds to somehow still be a starter for the U.S. in 2026. Barring a medical and logical miracle, that means there are a lot of center back minutes up for grabs this cycle, and fortunately, the U.S. 2006-2008 age cohort possesses the most exciting group of blue-chip center back prospects the country has ever seen.
Chief among them is German-American Noahkai Banks, who featured 23 times for Augsburg in the Bundesliga last season and is arguably a top-10 center back prospect globally. The only problem is that he declined a March USMNT senior call-up to keep his dual-national eligibility intact. That doesn’t rule him out of representing the U.S. in the future, and the likes of Nico Schlotterbeck, Malick Thiaw, Finn Jeltsch, and €50 million Chelsea target Karim Coulibaly mean the pathway to Germany minutes is unclear. If Banks eventually decides to represent the U.S., he’ll be among the clear favorites to start from the get-go.
3. Christopher Cupps (Chicago Fire; 22)
This was one of the most challenging choices to make on the entire list. That aforementioned 2006-2008 age bracket has several center backs who could break into the national team picture in the next two years, and join Banks as a rare second young center back on a World Cup roster (though it would be far from a surprise, whether Banks commits to the U.S. or not, if multiple defenders from the 2006-2008 crop make the team).
Sporting Kansas City’s Ian James, the Philadelphia Union’s Neil Pierre, and Werder Bremen II’s Ramiz Hamouda are the three others I strongly considered, and any one of those could certainly explode in the near future. However, I find that Christopher Cupps, currently featuring for Chicago Fire II, has the highest ceiling of the bunch. Still just 18, Cupps has all the physical tools needed for an elite-level center back and has a top-level mindset that has enabled him to steadily develop his other skills. He has also shown those capabilities in a U.S. shirt, starring at the last U-17 World Cup and captaining practically every youth team he’s ever played on at every age group. While he has faced injury setbacks in the last year or so, if Cupps stays healthy and continues to develop to his full potential, he will be on the national team by 2030.
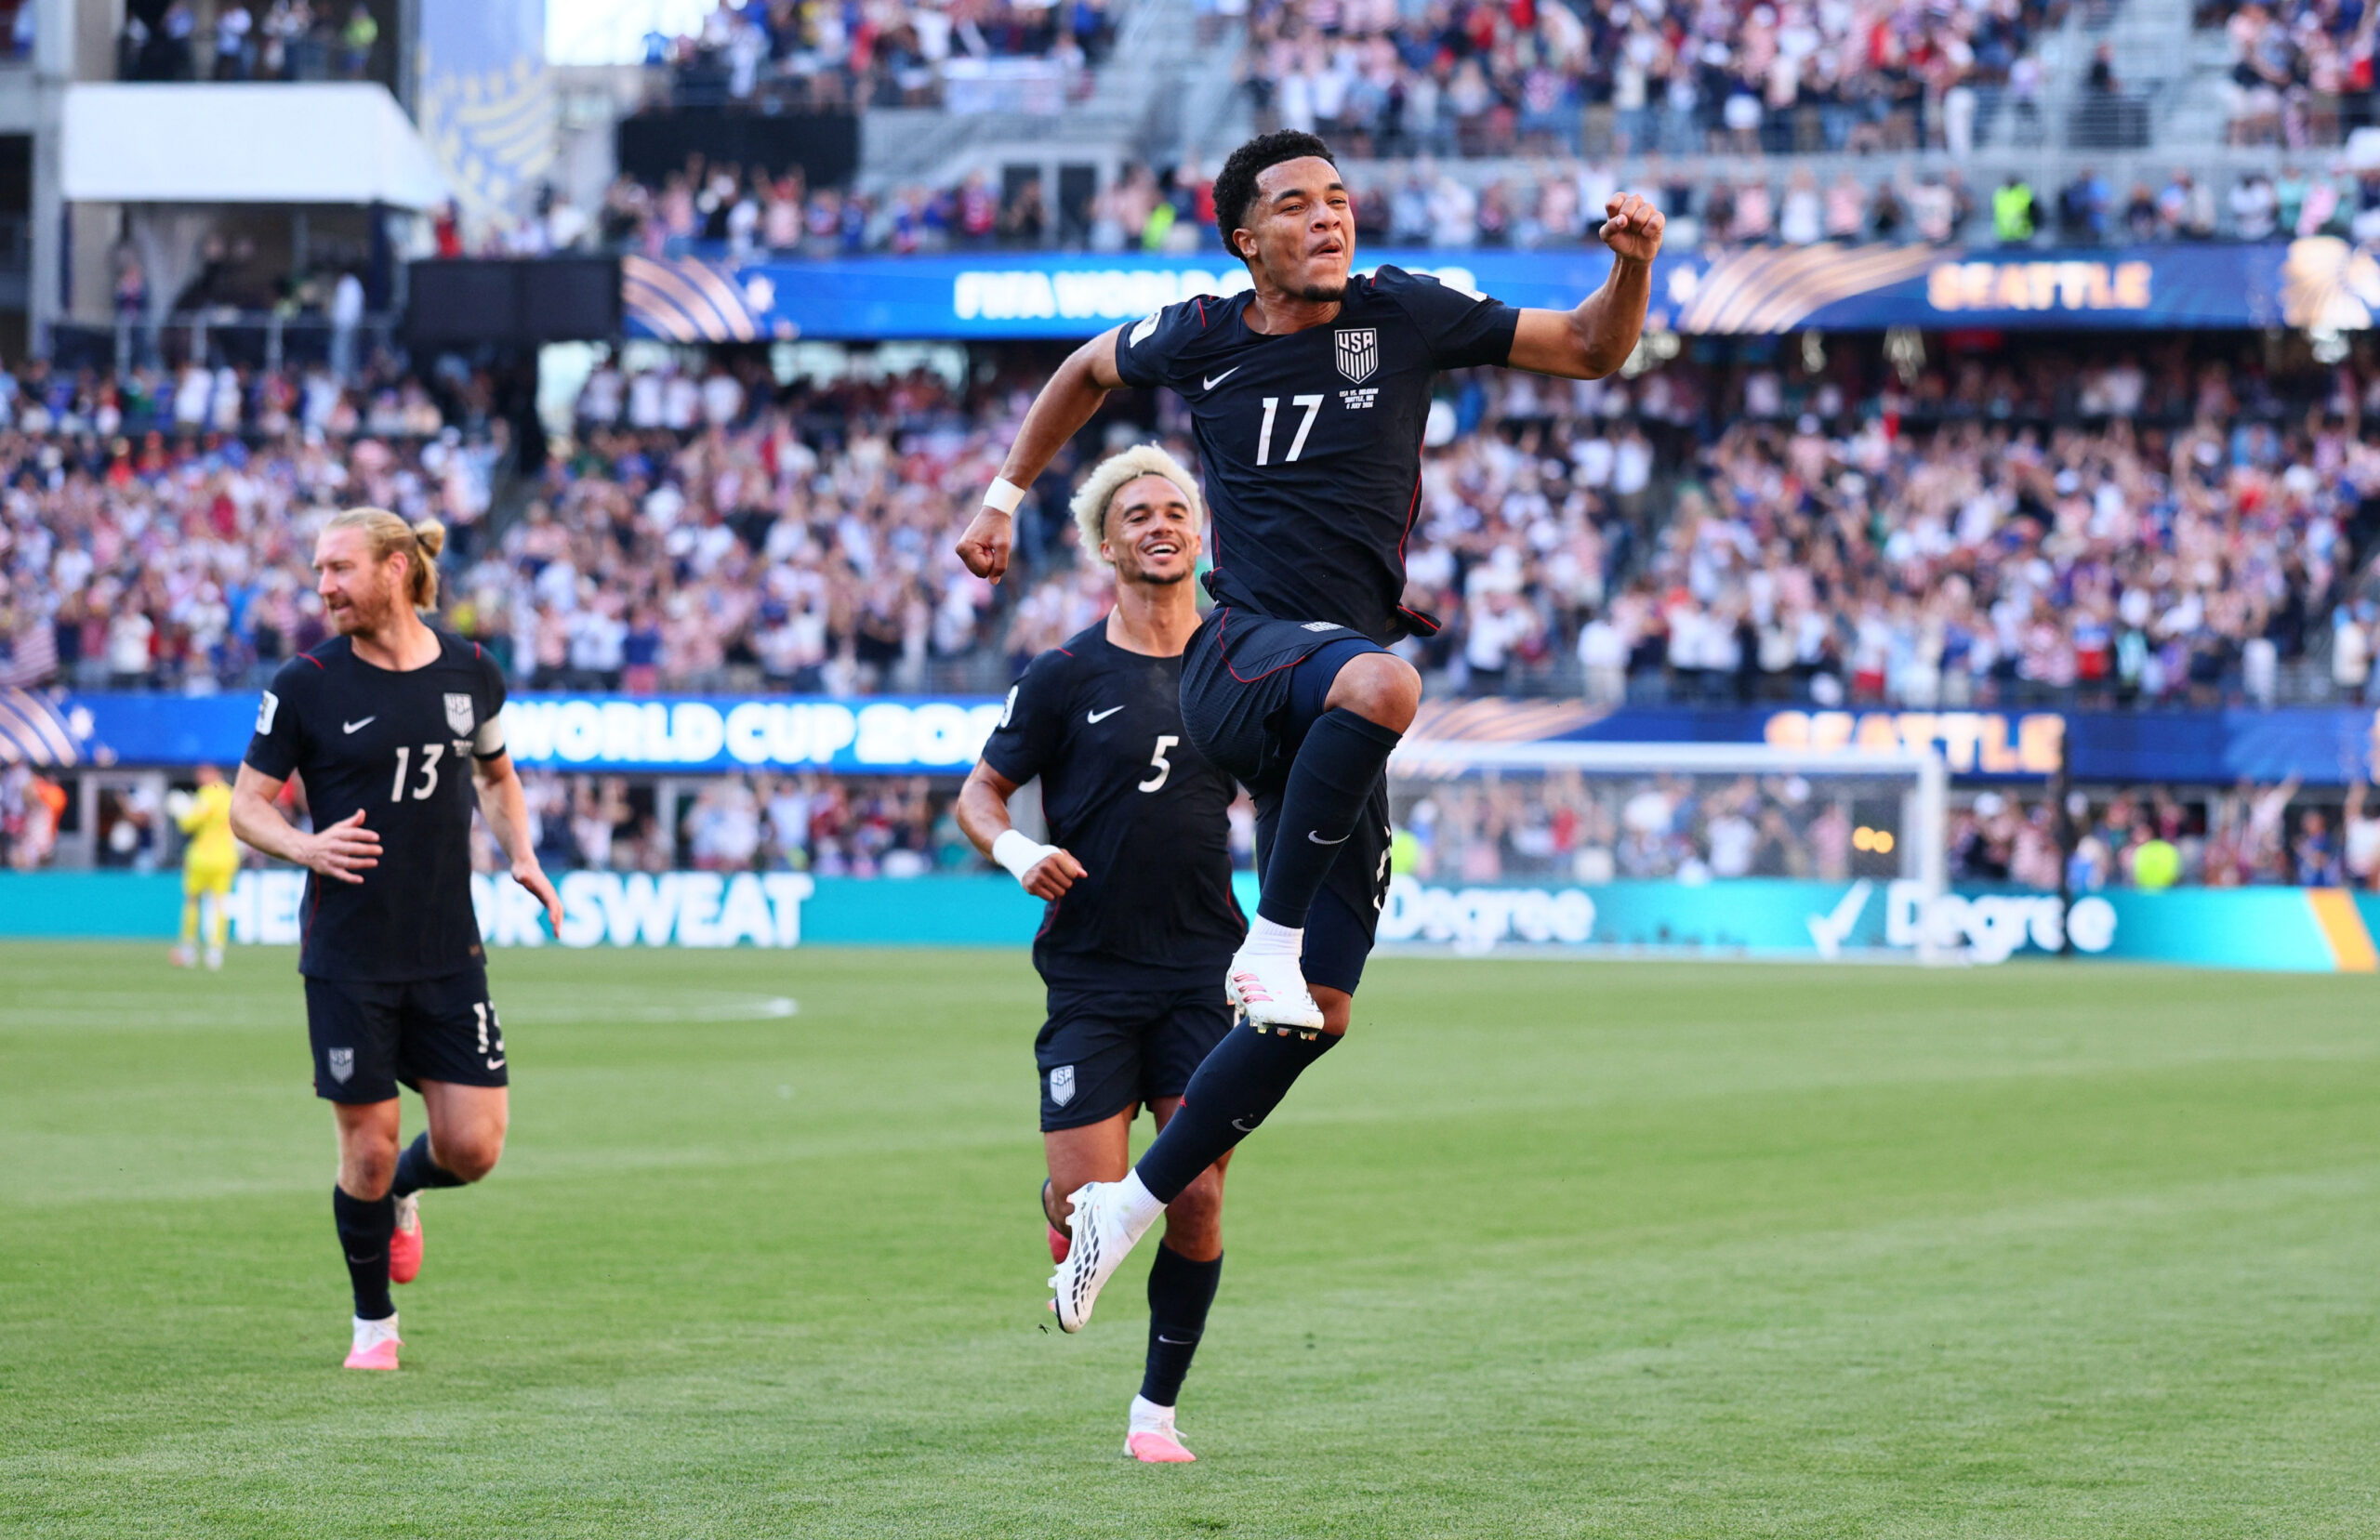
4. Auston Trusty (Celtic; 31)
I’ll be the first to admit that I was not an Auston Trusty advocate for a very, very long time. The last six months have changed my mind. In seeking a prime-age, left-footed center back to consider for 2030, Trusty currently seems like the best option, and is already someone who entered the USMNT history books when he scored the second-fastest goal in U.S. World Cup history last month. If he stays roughly level with the likes of Mark McKenzie, Miles Robinson, and Cameron Carter-Vickers, Trusty’s left-footedness will give him a clear edge.
Potential pool players: Mark McKenzie, Ian James, Neil Pierre, Ramiz Hamouda, Cameron Carter-Vickers, Josh Wynder
Full backs
1. Alex Freeman (Villarreal; 25)
Alex Freeman’s ascent from MLS Next Pro to USMNT World Cup star in the last 18 months has been something special. Now, he looks like a clear lock for the next edition as well and is currently on a trajectory to become a top La Liga right back within the next two seasons. Unless injuries crop up or his form completely stalls, Freeman will be a mainstay for the USMNT for years to come.
2. Peyton Miller (New England Revolution; 22)
Addressing the elephant in the room: Antonee Robinson is not on this list. While he has been a locked-in starter for the U.S. for six years, was at one point among the best in his position in the Premier League, and is arguably the country’s greatest-ever left back, the now 28-year-old has battled a truly painful run of injuries over the last few years. Robinson himself admitted it was a minor miracle that he was healthy enough to play in the 2026 World Cup, so given his injury history and the fact that he’ll be nearly 33 when 2030 kicks off, I decided to leave him out.
In terms of prospects, there are a few, and Peyton Miller is the most obvious, even if he’s spent much of his youth national team career playing as a winger. The 18-year-old from Connecticut heavily featured at the 2023 U-17 World Cup and 2025 U-20 World Cup, playing up age groups both times, and is a regular for a good team in MLS with European interest certain. If he develops, and particularly if the U.S. sticks with a wingback-reliant formation, I could see Miller emerging as a Robinson successor.
3. Luca Bombino (San Diego FC; 23)
A more traditional left-sided fullback for the future would be Luca Bombino of San Diego, who has developed well over the last year and a half and is now one of the best young left backs in MLS. The question now is whether he can take another big step in his development to fill the much-needed national team profile of lockdown left-back, and, if he can, eventually make the move to Europe. Christian McFarlane, Reed Baker-Whiting, and the still-talented but injury-riddled Caleb Wiley are other names who could make a push on the left side.
4. Sergiño Dest (PSV Eindhoven; 29)
It feels like just yesterday that Sergiño Dest was the skillful, adventurous young wingback at Ajax; it’s bizarre to even think about the fact that he’ll be 29 at the next World Cup. Dest has not reached the heights many hoped he would as a teenager; even if he has finally found a permanent home at the club level, it’s not at a European giant in a top five league. If (and this is a big if) he stays healthy, Dest should still make the 2030 roster, but he’ll certainly have to adapt his game as he inches toward the latter half of his prime.
5. Tim Weah (Olympique Marseille; 30)
Tim Weah is another one whose status as a clear roster lock will likely fade in the next cycle as younger players begin to emerge. The OM winger hardly played in this past World Cup and was, somewhat alarmingly, an unused substitute in both of the U.S.’s knockout games. Still, by 2030, his versatility and experience may make him a valuable option to keep around in a position group that could be very young for the U.S. in four years.
One more name I’d like to throw in there is Montrell Culbreath of Bayer 04 Leverkusen. If he commits to the United States over Germany, he is a wild-card right wing back option that almost certainly would walk straight into any U.S. roster overnight and if he continues his current ascent, could be an option to start in 2030.
Potential pool players: Montrell Culbreath, Frankie Westfield, Joe Scally, Reed Baker-Whiting, Christian McFarlane, Caleb Wiley
Central midfield
1. Adri Mehmeti (New York Red Bulls; 21)
The fact that only three true central midfielders went to the World Cup with the U.S. in 2026 indicates that it’s a position completely up for grabs in the next cycle. Enter Adri Mehmeti, who is one of the absolute most exciting U.S. prospects at the moment. The Albanian-American broke through into the New York Red Bulls first team at 16 this season and played the full 90 minutes in seven consecutive MLS games heading into the World Cup break. Learning under USMNT legend Michael Bradley, Mehmeti seems poised to be a Tyler Adams successor of sorts for club and country, and if he continues to progress at his current pace, could have his coming-out party at the 2030 World Cup.
2. Tyler Adams (AFC Bournemouth; 31)
Adams will still be around in four years and has been one of the USMNT’s most consistent players through his entire national team career. However, like Antonee Robinson, persistent injuries are taking a toll, and there’s no certainty he’ll be at as high a level as he once was come 2030. Nonetheless, unless his level drops too much, expect Adams to remain firmly entrenched as a veteran leader – and, by now, one of the U.S.’ greatest-ever midfielders – on the team at age 31.
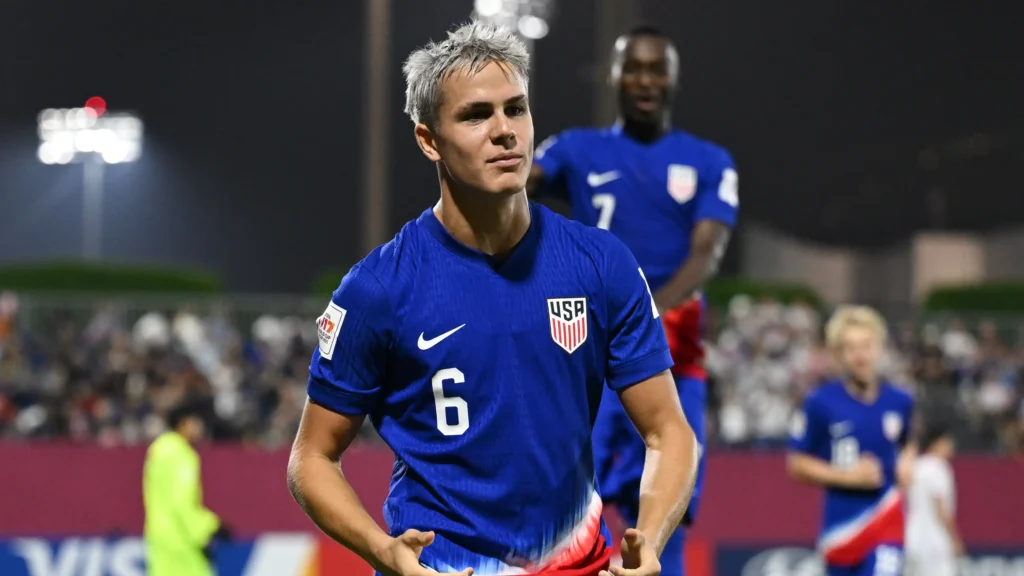
3. Sebastian Berhalter (Vancouver Whitecaps; 29)
One of the most surprising stories of the last cycle was the emergence of Sebastian Berhalter, who, within two years, went from a fringe MLS starter to arguably the league’s best midfielder. An impressive showing in the World Cup, which saw him make four strong substitute appearances and score in his lone start, means his stock is higher than ever, and even at 25, a move to Europe seems like a distinct possibility. If he maintains that level throughout what are expected to be his prime years, Berhalter could be able to maintain his status as a national team squad player for 2030.
4. Jude Terry (Los Angeles FC; 21)
I’m taking a bit of a punt here by including LAFC’s Jude Terry as one of the final players to make the roster. He’s one of eight players on this list who will be 22 or younger in 2030, which is a lot compared to the two that made the 2026 roster (Brady and Freeman), but he’s a composed and tenacious profile that I quite like and stands out among the rather deep pool of talented young midfielders who could break into the pool for 2030… provided that LAFC enables him to find the right pathway. Niko Tsakiris, Brooklyn Raines, Pedro Soma, Matthew Corcoran, Taha Habroune, Benjamín Cremaschi, and even Sergio Oregel are among the names that have the talent to push for a spot, though the currently 17-year-old Terry is my favorite of the bunch.
Notably, I decided not to include any of the prime-age midfielders who failed to make the 2026 roster; Tanner Tessmann, Jack McGlynn, Aidan Morris, and Paxten Aaronson are the first to come to mind; seeing as I’ve retained all of the U.S. midfielders in this roster (barring Cristian Roldan, who will be 35), none of that group raise the floor of the team significantly if at all. I also left off Johnny Cardoso, despite clearly being a leading U.S. talent at the club level – he will be 28 and certainly in with a shout, but unless the next USMNT manager (whether it is Pochettino or someone else) can truly unlock his maximum level, his consistently poor performances at the international level may prevent him from making a World Cup roster. Similarly, Yunus Musah needs a revival at both the club and international levels if he wants to re-enter the picture.
Potential pool players: Johnny Cardoso, Niko Tsakiris, Yunus Musah, Aidan Morris, Brooklyn Raines, Jack McGlynn, Taha Habroune, Benjamín Cremaschi, Tanner Tessmann
Attacking midfield
1. Cavan Sullivan (Philadelphia Union, joining Manchester City; 20)
Something will have gone wrong for Cavan Sullivan if he isn’t a 20-year-old rising star on the USMNT’s World Cup roster four years from now. The Philadelphia Union’s biggest prospect, who has already agreed to join Manchester City in 2028 after he turns 18, has all the potential in the world and is already getting regular MLS minutes at the age of 16. Marketed as America’s greatest hope in many years, and one of the highest-rated teenage talents in U.S. history, 2030 could be a special opportunity for Sullivan to introduce himself to the wider U.S. public and footballing world.
Sullivan is the youngest player in this projected roster, though not the youngest mentioned; the Chicago Fire’s Robert Turdean, who is about three months younger than Sullivan and widely considered the second- or third-biggest prospect in that age bracket, is also one to keep an eye on. While a lot can happen in four years, 2030 may come too soon for him.
2. Malik Tillman (Bayer 04 Leverkusen; 28)
A pleasant surprise from the USMNT’s 2026 World Cup run was the fact that Malik Tillman – operating as a deep-lying playmaker next to Tyler Adams – was arguably the team’s top performer, despite playing the entire tournament outside of his natural position. He’s one of the biggest raw talents in the entire U.S. pool, so again, unless his form falls off of a cliff, he’ll be back in 2030 and should be in his prime. After a rough start to his international career, the FC Bayern product has finally found a rhythm and is now, quite incredibly, the United States’ joint-all-time leader in World Cup knockout goals.
3. Weston McKennie (Juventus; 31)
After a career year with Juventus in 2025/26 and a very solid World Cup performance, Weston McKennie has solidified himself not just as the consensus #2 USMNT player of his generation, but arguably as one of the greatest ever. If he continues playing at a high level, there’s no reason he won’t still be playing for the national team in 2030, even if he’s on the opposite side of his prime by then. It’s impossible to know what his position will be by then – he’s played a completely different role at each of the last three major tournaments – but it’s almost certain he’ll be involved in some capacity.
Potential pool players: Máximo Carrizo, Robert Turdean, Paxten Aaronson, Brenden Aaronson, Marvin Dills
Wingers
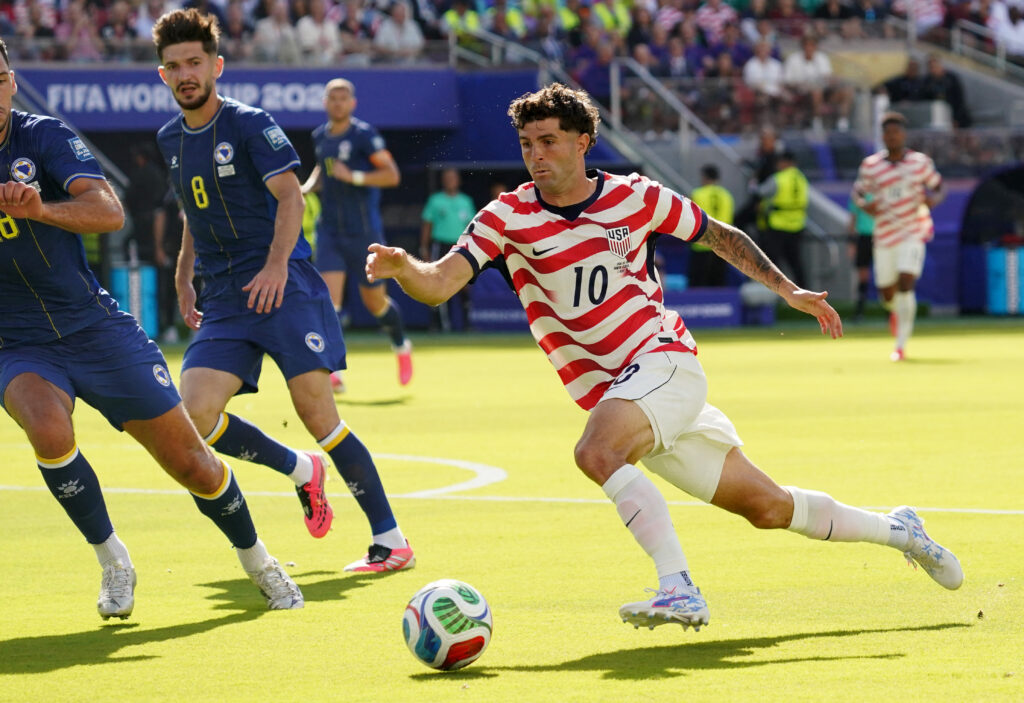
1. Christian Pulisic (AC Milan; 31)
There’s no need for reactionary post-2026 World Cup takes here: regardless of where in the world he’s playing, a healthy Christian Pulisic will almost certainly make the 2030 World Cup roster. At 27, there is a decent chance that the best and most consistent version of Pulisic is already behind us, and that is certainly a difficult pill to swallow. However, he still has plenty to give at both the club and international levels, and 2030 could be a great redemption opportunity for him in what will more than likely be his final World Cup.
2. Mathis Albert (Borussia Dortmund; 21)
From someone who broke through at Borussia Dortmund ten years ago to one who will break through there this year. Mathis Albert is one of the top U.S. prospects at the moment, and after debuting for BVB at the end of last season, he seems to be on the right trajectory toward being a future star. Additionally, the winger already has an impressive U-17 World Cup under his belt, shining at last fall’s edition despite playing up an age group; he’s eligible to return again for this year’s edition.
3. Zavier Gozo (Real Salt Lake; 23)
It’s clear that beyond Pulisic, winger is a position of desperate need for the U.S., which opens the door to lots of exciting young stars. As one of the final cuts from the 2026 roster despite still being uncapped, Zavier Gozo is clearly one of them. Gozo is one of MLS’ leading young talents right now and just made the league’s All-Star team as a 19-year-old; he also had a great U-20 World Cup last fall playing up two years. If he picks up his momentum from where he left off in the first half of the MLS season, the RSL homegrown will quickly break into the USMNT roster this fall, and should soon earn a move to a club in Europe’s top five leagues.
4. Gio Reyna (Borussia Mönchengladbach; 29)
Maybe a hopeful inclusion given his club form, but Reyna is undoubtedly the top U.S. talent in the early-2000s generation. He hasn’t been able to put it together regularly at the club level for years, but when he’s worn the national team uniform, he has consistently performed, and that earned him the trust of Mauricio Pochettino at the end of this past cycle. If Reyna can stay healthy and put the pieces together, I can see him making a third consecutive World Cup roster, likely once again as a wild card option from the bench. With that being said, he may need to take one step backward this summer to take two steps forward for the rest of the cycle.
An intentional omission here was Diego Luna, who has made many similar 2030 projections in recent days. While the 18-time U.S. international will probably get some call-ups in the coming months, he hasn’t done anything in a USMNT shirt anytime recently to suggest he has earned a return to the team. As a low-ceiling option whose only signature moments for the U.S. came in a January friendly and against Guatemala, there isn’t much point in persisting with Luna over younger, more exciting talents… like his club teammate Gozo.
Potential pool players: Cole Campbell, Nimfasha Berchimas, Quinn Sullivan, Kevin Paredes, Álex Zendejas
Center forwards
1. Folarin Balogun (AS Monaco; 28)
It’s been quite some time since the USMNT striker debate was this clear. The version of Folarin Balogun that showed up at the 2026 World Cup is arguably the best by an American striker in 96 years, and ridiculous red card controversy aside, he was one of the stories of the tournament for the U.S. team, scoring three times. As long as he keeps things rolling and continues scoring for club and country at the rate he is right now, Balogun will undoubtedly start for the U.S. once again in 2030 and at 28, he should be at the peak of his powers.
2. Julian Hall (New York Red Bulls; 22)
Another teenage MLS All-Star who seems poised for big things. Julian Hall exploded to start the 2026 season, playing so well that he was being talked about as a potential wild card option for this year’s World Cup. While that obviously didn’t happen, the 18-year-old – who notched his first senior hat trick against the Columbus Crew in May – is now someone firmly entrenched in the national team conversation and could break through as soon as this fall for friendly matches. The expectation would be that he will be in Europe within two to three years, and if that goes well, there’s likely no question he’ll be at the World Cup… as long as he doesn’t choose to represent Poland instead.
3. Malik Jakupović (Philadelphia Union; 21)
This is perhaps my boldest pick on the list, so I suppose I’m saving the best for last. Malik Jakupović is only 16 right now, but already stands at 6’3” (1.93m) and has an intriguing profile for a future off-the-bench USMNT attacking option. In addition to an excellent aerial ability, the Union striker presses very well and is rightfully getting minutes for an admittedly terrible Eastern Conference team. It is worth mentioning that Jakupović is also eligible for Bosnia & Herzegovina; U.S. Soccer will have to manage the situation well to avoid another Esmir Bajraktarević saga.
Unfortunately, the inclusion of Jakupović takes Ricardo Pepi out of the equation, which is one of the harshest decisions I had to make here. Despite being one of the top USMNT goal scorers under Gregg Berhalter, Pepi has struggled mightily since Mauricio Pochettino took over and has not scored for the U.S. in two years. Despite that, if he continues playing well at the club level, the El Paso native should be just fine.
CF: Ricardo Pepi, Damion Downs, Patrick Agyemang, Josh Sargent, Marcos Zambrano, Alexander Staff
Final Thoughts
In the impossible exercise that is future roster projection, I feel pretty good about this one. It includes 14 players from the current 2026 roster, which is just one more than the number that carried over from 2022 to 2026. The team’s average age is just over 26, making it slightly younger than the 2026 roster – aided by the absence of a nearly 39-year-old – but still older than the notably young 2022 team.
The more revealing detail, though, is the shape of the roster. Only three players on this list – Alex Freeman, Chris Brady, and Diego Kochen – would be between 24 and 27 years old in 2030, the age range that should theoretically be entering its prime. That reflects one of the defining developments of the last cycle, which is that many of the top prospects from the 2003 to 2006 age groups simply did not break through at the level once expected. It also doesn’t help that the two best American-born 2005s, Esmir Bajraktarević and Obed Vargas, now represent other national teams.
Four years ago, in my way-too-early projection for the 2026 roster, I correctly predicted 14 of 26 players. My biggest mistake was backing several prospects from those 2003-2006 age groups to emerge, only for late bloomers like Sebastian Berhalter, Max Arfsten, and Álex Zendejas to make the roster instead of players who were then part of the U.S. U-20 and U-17 pools.
The optimism here is less about the middle of the player pool and more about the next wave, particularly the 2007 to 2009 cohorts. Not all of those players will pan out, but there are enough high-end talents in those age groups to believe that several fresh faces will force their way into the USMNT picture before 2030.
The other notable thread is continuity from the last two tournaments. Seven players on this roster – Tyler Adams, Sergiño Dest, Weston McKennie, Christian Pulisic, Gio Reyna, Matt Turner, and Tim Weah – would be making a third World Cup roster. That group has defined this era of the USMNT, and if they are at the end of or past their prime four years from now, they would form the veteran spine around which the next generation is built – something that generation simply did not have to lean on in 2022.
USMNT
When Your Team Keeps Breaking Your Heart: Life as a USMNT Fan
USMNT
Ranking the Most Impactful USMNT Players in World Cup History
Thomas Deschaine (@uskeeper on X and us_keeper on Instagram)
The U.S. Men’s National Team has played 37 World Cup matches across ten tournaments, producing no shortage of memorable moments and standout performances. Below is my ranking of USMNT players based on their World Cup impact, some from a single tournament, others across multiple appearances.
I’ve taken a few liberties with ties, as in several cases no single player clearly stood above the rest; instead, the moment itself, and the collective effort, defined the performance.
Honorable Mention:
Marcelo Balboa – Appearing in three consecutive World Cups (1990, 1994, and 1998), he anchored the USMNT defense throughout an important era of growth for the program. He also came close to one of the tournament’s most memorable moments with a spectacular bicycle kick attempt off a corner against Colombia that nearly found the net.
Michael Bradley – Across three World Cups (2006, 2010, and 2014), Michael Bradley was a driving force in the USMNT midfield, known for his engine, composure, and leadership. He delivered a crucial game-tying goal against Slovenia in 2010 and later provided the assist on Julian Green’s memorable strike in 2014, consistently stepping up in key moments on the world stage.
Cobi Jones – While Cobi Jones remains the all-time leader in USMNT caps and earned 11 World Cup appearances across three consecutive tournaments, he did not register any goal contribution in any of those World Cups.
Eddie Pope – Across three World Cups (1998, 2002, and 2006), Eddie Pope was a cornerstone of the USMNT backline, known for his composure, positioning, and aerial dominance. He played a vital role in the team’s run to the quarterfinals in 2002, anchoring a disciplined defense and providing veteran leadership against some of the world’s top attacking talent.
Matt Turner – If Turner earns the starting role and delivers a standout performance during a deep USMNT run, coming up with game-changing saves, he could break into the top 10 while surpassing the current records for wins and shutouts.
#10 – 1930 USMNT Pioneers-TIED
Jimmy Douglas
World Cups: 1 (1930)
Matches: 3
Wins: 2
Shutouts: 2
Bert Patenaude
World Cups: 1 (1930)
Matches: 3
Goals: 4
Assists: 2
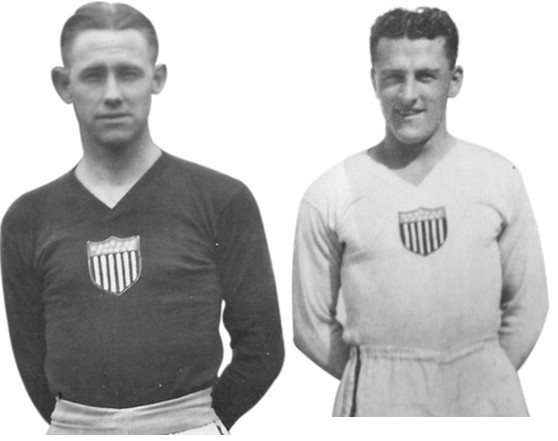
With limited historical data and in the context of the very first FIFA World Cup, I’m combining two true pioneers of the USMNT. Jimmy Douglas remains the only USMNT goalkeeper to record two wins and two shutouts in World Cup play, all achieved at the inaugural 1930 tournament, where the United States secured a third-place finish.
On the attacking side, Bert Patenaude scored four goals in that same tournament, including a hat trick in the U.S. second and final group-stage match. His performances were instrumental in helping guide the United States to its third-place finish in the first-ever FIFA World Cup.
#9 – 1950 USMNT Heros-TIED
Frank Borghi
World Cups: 1 (1950)
Matches: 3
Wins: 1
Shutouts: 1
Joe Gaetjens
World Cups: 1 (1950)
Matches: 3
Goals: 1
Assists: 0
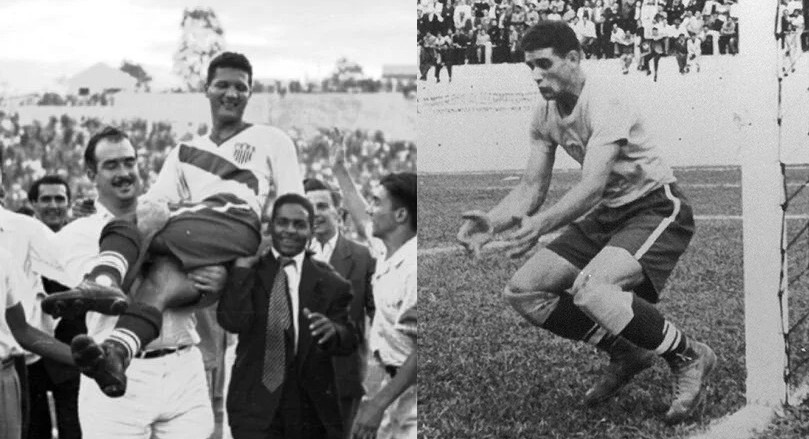
Another historic meeting, shaped by similar circumstances to the first group, but what is known for certain is that the USMNT pulled off a stunning victory over one of the top sides at the 1950 World Cup. Frank Borghi delivered a remarkable performance in goal throughout the match, standing firm under relentless pressure.
The breakthrough came in the 38th minute when Joe Gaetjens scored a crucial goal to give the USMNT the lead. From there, the match shifted entirely onto the shoulders of the U.S. defense and goalkeeping, who held strong to secure a famous 1–0 victory over England one of the greatest upsets in World Cup history.
Earnie Stewart
World Cups: 3 (1994, 1998, 2002)
Matches: 11
Goals: 1
Assists: 0
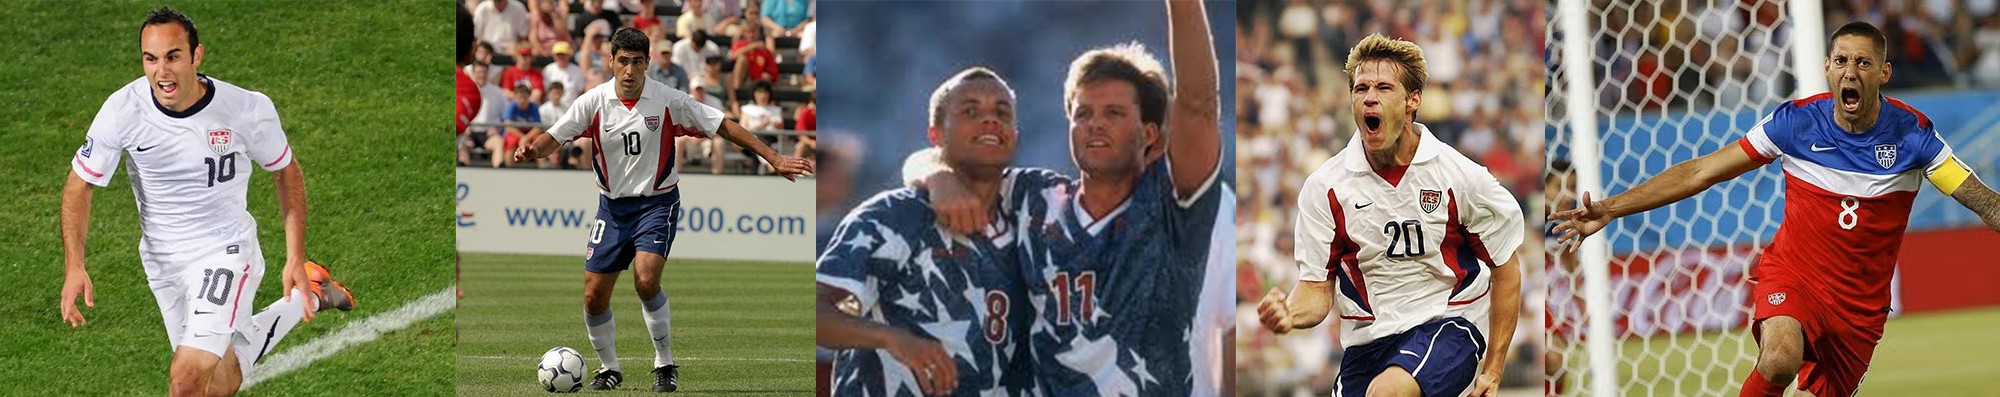
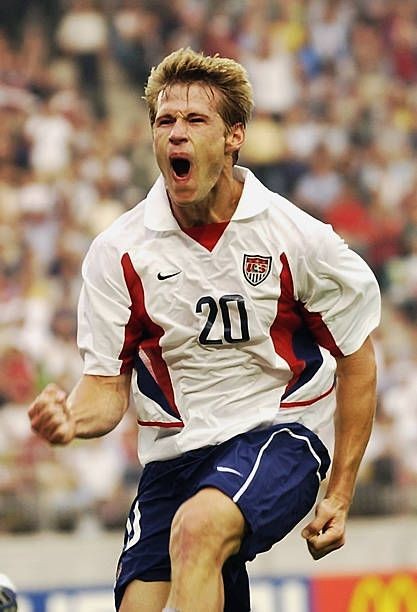
#8 – 1994 USMNT Trailblazers-TIED
Eric Wynalda
World Cups: 3 (1990, 1994, 1998)
Matches: 8
Goals: 1
Assists: 0
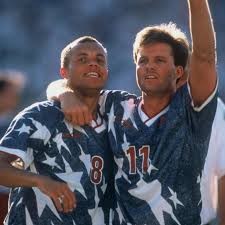
Two of the USMNT’s early trailblazers, Eric Wynalda and Earnie Stewart, delivered defining World Cup moments on home soil at the 1994 FIFA World Cup. Both played pivotal roles in energizing a new generation of American soccer fans.
The USMNT’s first goal of that tournament came via one of the most iconic set pieces in World Cup history, earning a crucial draw in the opener. That momentum carried forward when Stewart netted the game-winner against heavily favored Colombia, securing the United States’ first World Cup victory since 1950.
.
#7 – Claudio Reyna
World Cups: 4 (1994, 1998, 2002, 2006)
Matches: 10
Goals: 0
Assists: 0
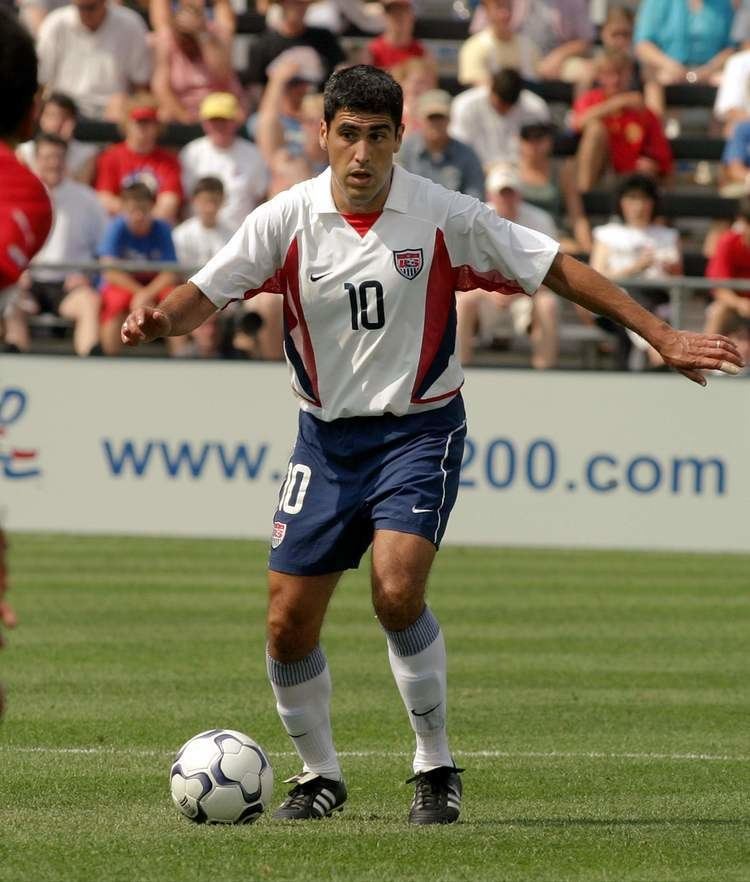
Named to four World Cup squads and appearing in three, Claudio Reyna was a cornerstone of the USMNT for more than a decade. While he didn’t record a goal contribution on the World Cup stage, his influence was undeniable, dictating tempo, providing composure in midfield, and serving as captain in both the 2002 and 2006 tournaments.
#6 – DaMarcus Beasley
World Cups: 4 (2002, 2006, 2010, 2014)
Matches: 11
Goals: 0
Assists: 1
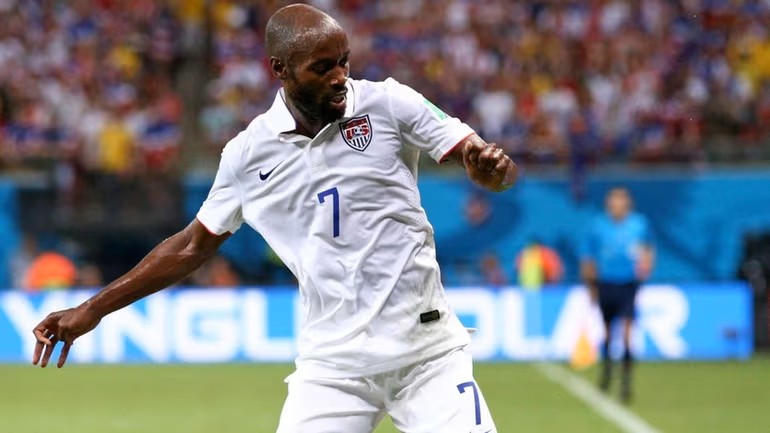
DaMarcus Beasley is the only USMNT player to appear in four World Cups (2002, 2006, 2010, 2014), a testament to his remarkable longevity, versatility, and consistent impact across multiple generations.
He emerged on the global stage at the 2002 World Cup as an explosive, attack-minded winger, using his pace and direct play to stretch defenses and play a key role in the United States’ run to the quarterfinals. As his career progressed, Beasley reinvented himself, most notably transitioning to left back by the 2014 World Cup, where his experience, defensive discipline, and composure helped stabilize the back line against elite international competition.
#5 – Brad Friedel
World Cups: 3 (1994, 1998, 2002)
Matches: 6
Wins: 2
Shutouts: 1
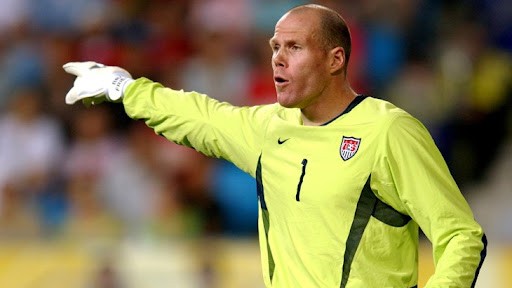
Brad Friedel’s World Cup legacy is defined by consistency, composure, and elite shot-stopping across multiple tournaments. He served as the primary starter at the 2002 World Cup, made a start at the 1998 World Cup, and was the backup to Tony Meola in 1994, providing a steady, reliable presence in goal during a pivotal era for the USMNT.
His standout performances came in 2002, highlighted by his penalty-saving heroics. Friedel recorded two penalty saves in the tournament (excluding shootouts), tying the World Cup record for most in a single edition. His ability to deliver in high-pressure moments played a key role in the United States’ run to the quarterfinals and solidified his place among the program’s all-time great goalkeepers.
#4 – Brian McBride
World Cups: 3 (1998, 2002, 2006)
Matches: 10
Goals: 3
Assists: 1
Brian McBride’s World Cup legacy is defined by big goals, relentless work rate, and a fearless, physical style that helped set the tone for the USMNT on the global stage. He scored the team’s only goal at the 1998 World Cup against Iran, rising to meet a corner kick with authority.
In 2002, he played a pivotal role in the opening-match upset of Portugal, constantly pressuring the defense and helping spark the historic win, before delivering again with a goal against Mexico in the Round of 16 to send the US. to the quarterfinals.
His grit and determination were on full display in his final World Cup in 2006, when he famously continued playing after suffering a broken nose and a bloodied face, an enduring symbol of his toughness, leadership, and commitment to the team.
#3 – Tim Howard
World Cups: 3 (2006, 2010, 2014)
Matches: 8
Wins: 2
Shutouts: 1
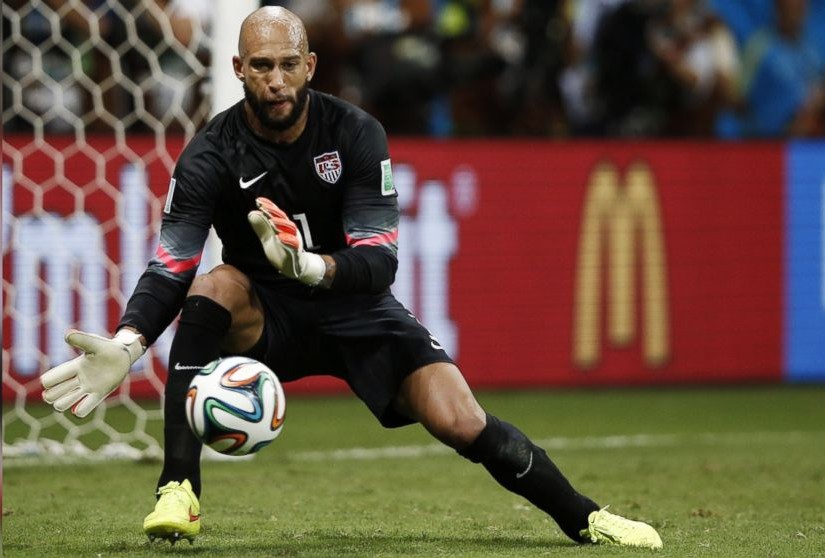
A starter in back-to-back World Cups, Tim Howard delivered on the biggest stage when it mattered most. From his record-setting 16-save performance against Belgium at the 2014 World Cup, widely regarded as one of the greatest goalkeeping displays in World Cup history, to his consistent ability to keep the United States competitive against elite opposition, he repeatedly elevated his game under pressure.
His shot-stopping brilliance, commanding presence, and calm leadership in high-intensity moments define a legacy that places him among the most influential goalkeepers the USMNT has ever had on the World Cup stage.
#2 – Clint Dempsey
World Cups: 3 (2006, 2010, 2014)
Matches: 10
Goals: 4
Assists: 0
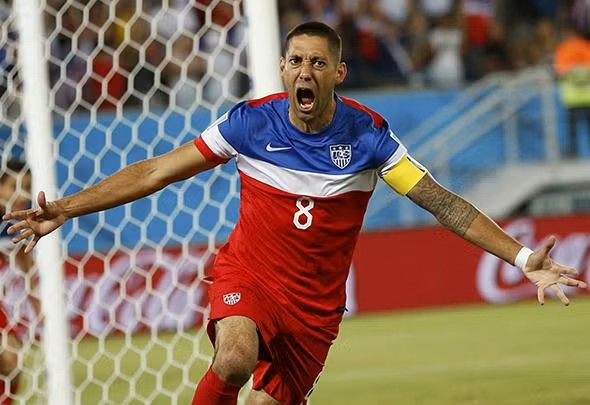
From his goal just 29 seconds into the match against Ghana at the 2014 World Cup, the fastest in USMNT World Cup history, to his composed finish against England in 2010 World Cup that helped secure a crucial draw, to becoming the first American to score in three different World Cups, Clint Dempsey consistently delivered on the game’s biggest stage.
Those moments, combined with his toughness, edge, and ability to show up in key situations, cement his place as one of the most impactful USMNT players in World Cup history.
#1 – Landon Donovan
World Cups: 3 (2002, 2006, 2010)
Matches: 12
Goals: 5
Assists: 3
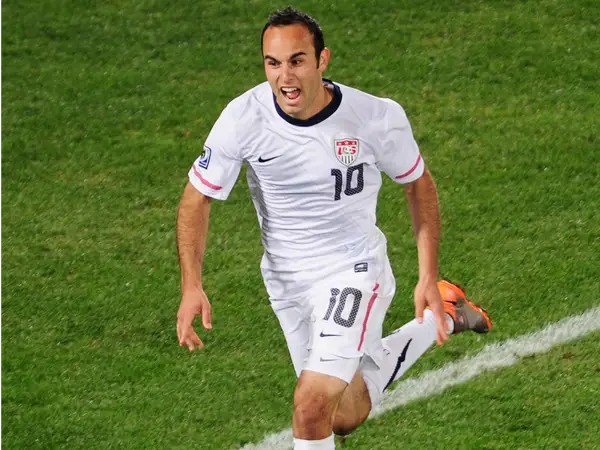
From his dramatic stoppage-time winner against Algeria that sent the USMNT into the knockout stage, to his goal in the “Dos a Cero” victory over Mexico that helped propel the team to the quarterfinals, to his deflected strike off Jorge Costa that contributed to him being named Best Young Player of the 2002 World Cup, Landon Donovan consistently delivered on the biggest stage.
Taken together, those moments make a strong case that he’s been the most impactful USMNT player in World Cup history, and it only adds to the “what if” of how much more he might have achieved had he been part of the 2014 squad.


Way-too-early USMNT 2030 FIFA World Cup roster projection

When Your Team Keeps Breaking Your Heart: Life as a USMNT Fan

Ranking the Most Impactful USMNT Players in World Cup History

-
 Club News6 years ago
CJ dos Santos, Benfica
-
 Club News6 years ago
Give: Support Chasing a Cup by Supporting our Cause
-
 USMNT2 years ago
Gregg Berhalter’s Legacy
-
 Club News6 years ago
Julian Vincente Araujo
-
 USMNT2 years ago
Medals on their Minds
-

 Club News2 years ago
American Transfers: Stock Up & Stock Down
-
 USMNT2 years ago
USMNT Kits Come in Different Styles and Colors
-
USMNT3 years ago
World Cup Format History